


DOGE: Chained 2017 GDP to US National Debt
Zero Hedge provided the spark to get at the real data.

Short Post.
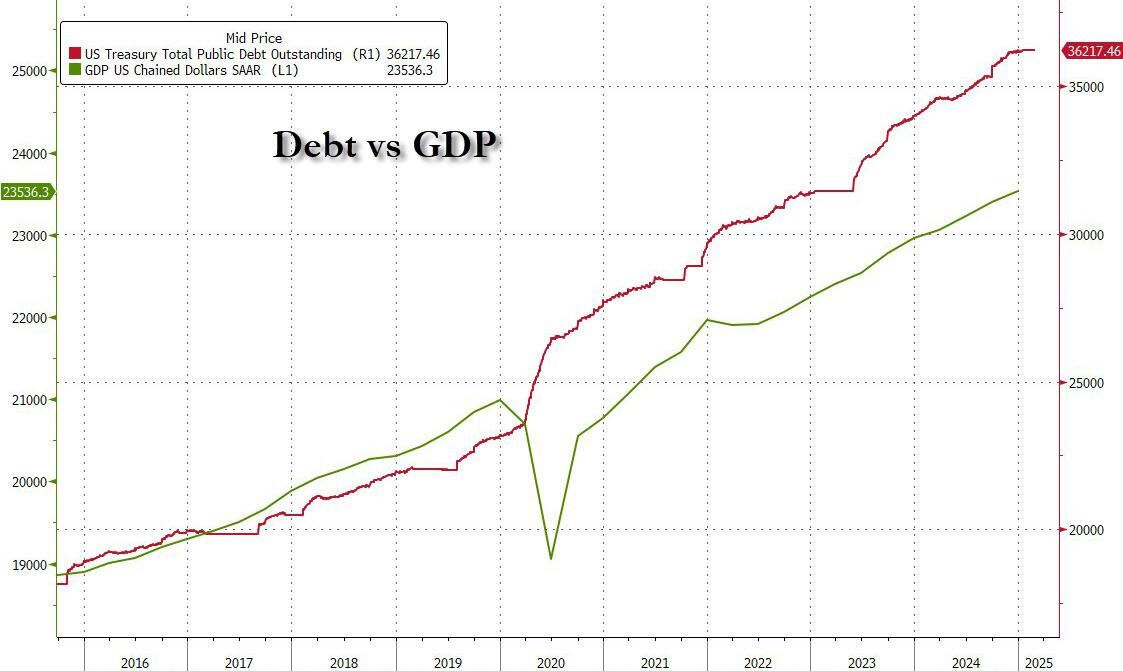
Zero Hedge posted how Chained GDP (2017) to National Debt moved over the period of 2016 to October 2024. Here is the graph posted. I didn’t like this graph because it has a scaling distortion from the primary to secondary axis. The data is real but too many may feel it presents data with an odd scaling.
So one fix it and added analysis that shows what happen regarding DEBT to GDP (2017 $).
From January 2017 to January 2020, the U.S. National Debt grew $2.61 for each dollar of GDP growth.
In the year 2020, the U.S. National Debt grew $13.4 for each dollar of GDP growth.
From January 2020 to October 2024, the U.S. National Debt grew $4.57 for each dollar of GDP growth.
From January 2021 to October 2024, the U.S. National Debt grew $3.26 for each dollar of GDP growth.


What is obvious is: during the pandemic debt exploded by $5 trillion. This was generated off scare tactics to shutdown the United States - and it paralyzed people into a host of bad behaviors, often without any choices given to them. (Local governments wrecked their economies - Democrats, in particular - and gorged themselves on COVID stimulus.)
This also pivoted the country towards more government-driven “growth” of GDP versus pre-Pandemic growth rate. That is what DOGE is correcting by saving money from finding fraud, waste and abuse. (Pulling the monetary punch bowl away from the D.C. BLOB Leviathan of corrupt bureaucrats and their agencies of evildoers. Since the 2024 fiscal budget deficit exploded to $2.3 trillion. While revenues are running only $1.45 trillion better.)

One can see that more clearly from the Zero Hedge scaling factor - but it again distorted this in a way that critiques would smirk and state it was done to make Trump’s pre-pandemic numbers look good. Can’t have that!
A counter: